
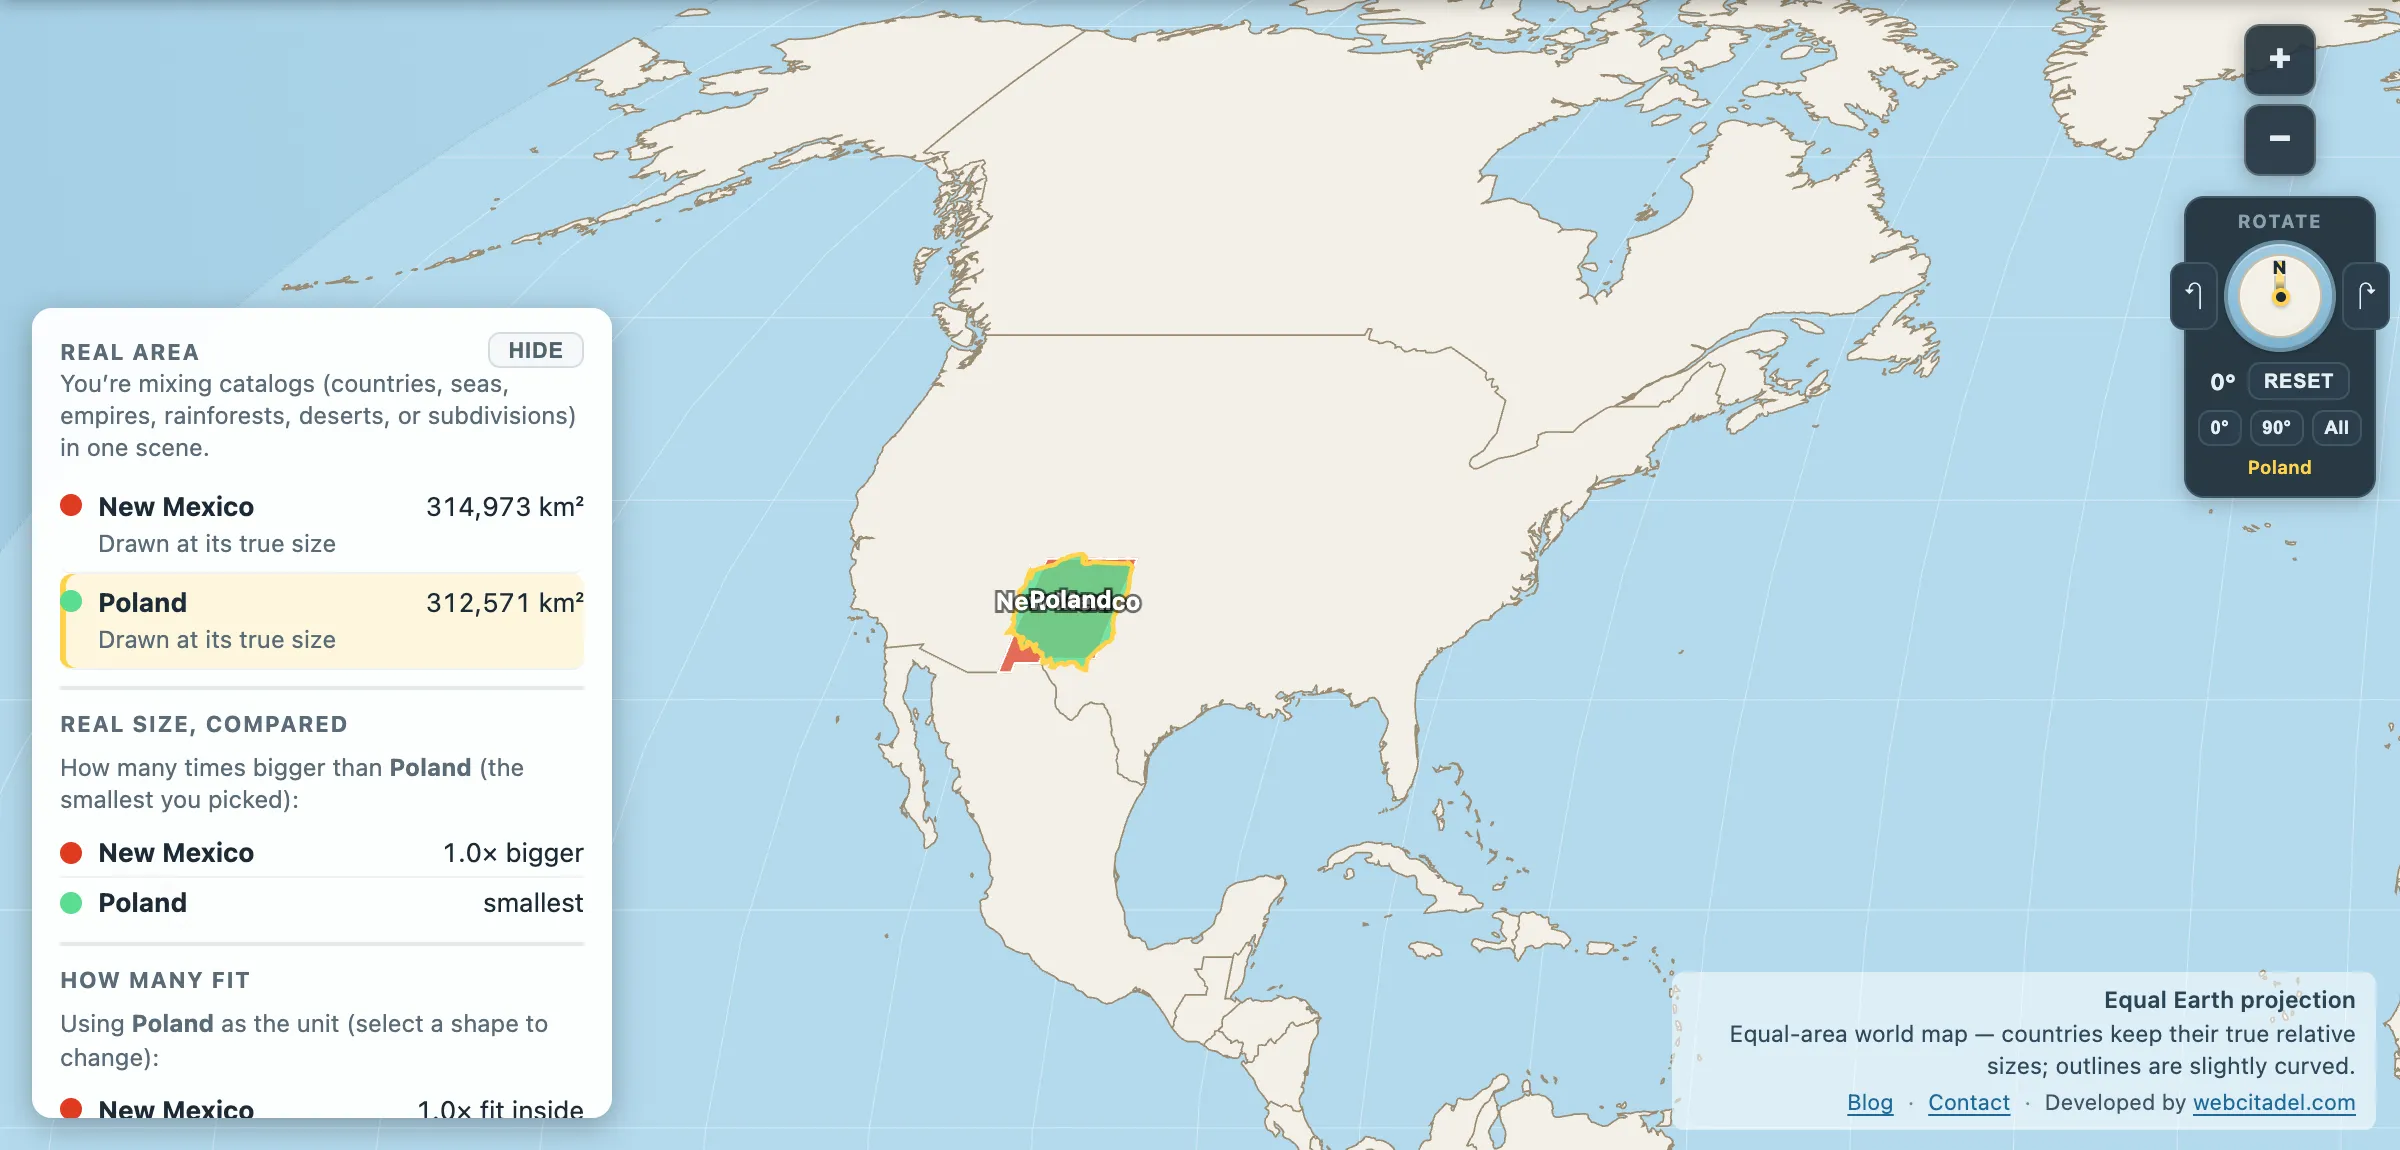
Americans measure the world in states. Everyone else measures the world in countries. Here is the conversion table, calculated from the same datasets the map uses, ranked by how close the match is.
Twenty-nine states have a country within 4 per cent of their own area. The smaller states — everything below West Virginia — run out of countries to pair with and are left out.
The near-perfect ones
| State | Area | Country | Area | Gap |
|---|---|---|---|---|
| Mississippi | 123,655 km² | Eritrea | 123,680 km² | 0.02% |
| North Carolina | 129,254 km² | Nicaragua | 129,227 km² | 0.02% |
| Iowa | 145,520 km² | Suriname | 145,561 km² | 0.03% |
| Tennessee | 109,140 km² | Cuba | 109,286 km² | 0.13% |
| Oklahoma | 181,012 km² | Cambodia | 181,376 km² | 0.20% |
| South Dakota | 199,284 km² | Kyrgyzstan | 198,664 km² | 0.31% |
| Louisiana | 123,059 km² | North Korea | 122,498 km² | 0.46% |
| Kansas | 212,964 km² | Guyana | 211,934 km² | 0.49% |
| Pennsylvania | 117,208 km² | Benin | 116,554 km² | 0.56% |
| Indiana | 93,642 km² | Hungary | 92,967 km² | 0.73% |
| New Mexico | 314,973 km² | Poland | 312,571 km² | 0.77% |
Suriname is bigger than Iowa by 41 km². Out of more than 145,000, the entire difference between a US state and a South American country is about one large farm.
The rest of the table
| State | Area | Country | Area | Gap |
|---|---|---|---|---|
| Colorado | 269,357 km² | New Zealand | 266,832 km² | 0.94% |
| Maine | 85,528 km² | Azerbaijan | 86,401 km² | 1.02% |
| Wyoming | 252,922 km² | Ecuador | 255,662 km² | 1.08% |
| Montana | 379,793 km² | Norway | 384,269 km² | 1.18% |
| Alabama | 134,038 km² | Bangladesh | 135,676 km² | 1.22% |
| Washington | 175,276 km² | Uruguay | 177,572 km² | 1.31% |
| Nevada | 286,087 km² | Philippines | 290,322 km² | 1.48% |
| Ohio | 106,923 km² | Guatemala | 108,521 km² | 1.49% |
| Arizona | 295,368 km² | Italy | 300,272 km² | 1.66% |
| New York | 126,931 km² | Nicaragua | 129,227 km² | 1.81% |
| California | 409,774 km² | Paraguay | 400,906 km² | 2.16% |
| Michigan | 150,914 km² | Nepal | 147,195 km² | 2.46% |
| West Virginia | 62,649 km² | Latvia | 64,255 km² | 2.56% |
| Georgia | 152,683 km² | Tunisia | 156,655 km² | 2.60% |
| South Carolina | 80,680 km² | Czechia | 78,488 km² | 2.72% |
| Alaska | 1,518,878 km² | Mongolia | 1,560,451 km² | 2.74% |
| Kentucky | 104,590 km² | Iceland | 101,162 km² | 3.28% |
| Texas | 688,751 km² | Myanmar | 662,756 km² | 3.77% |
Note the state of Georgia matches Tunisia. The country Georgia is 69,000 km², less than half its American namesake.
What the table is actually showing
Three things worth pulling out.
Mid-sized American states are country-sized, and we don’t talk like they are. Poland is a European power with forty million people and a thousand years of contested history. New Mexico is a state with two million people that most Americans think of as somewhere you drive through. Same footprint, to within one per cent.
The matches cluster in the developing world, and that’s an artefact of population, not land. Cuba, Nicaragua, Guyana, Suriname, Cambodia, Eritrea — these come up because there are simply more countries in the 100,000–200,000 km² band than in any other, and most of them are not in Europe. Europe’s countries are mostly smaller than an average US state, which is its own lesson: six of Europe’s biggest countries fit under the USA with room left over.
Texas is the outlier at the top. Its best match is Myanmar, and it isn’t a close one — Texas is nearly 4 per cent larger. Below Texas the American scale runs out of countries to pair with, which is why Texas beats France and Alaska more than doubles Texas.
Check any pair yourself
Open New Mexico with Poland dragged on top, on an equal-area map so neither gets a projection advantage.
Then swap in any row from the table. Type a state, type a country, drag one onto the other. The app mixes catalogs, so a US state and a sovereign country can sit on the same map at the same true scale — which is the only way this comparison means anything.
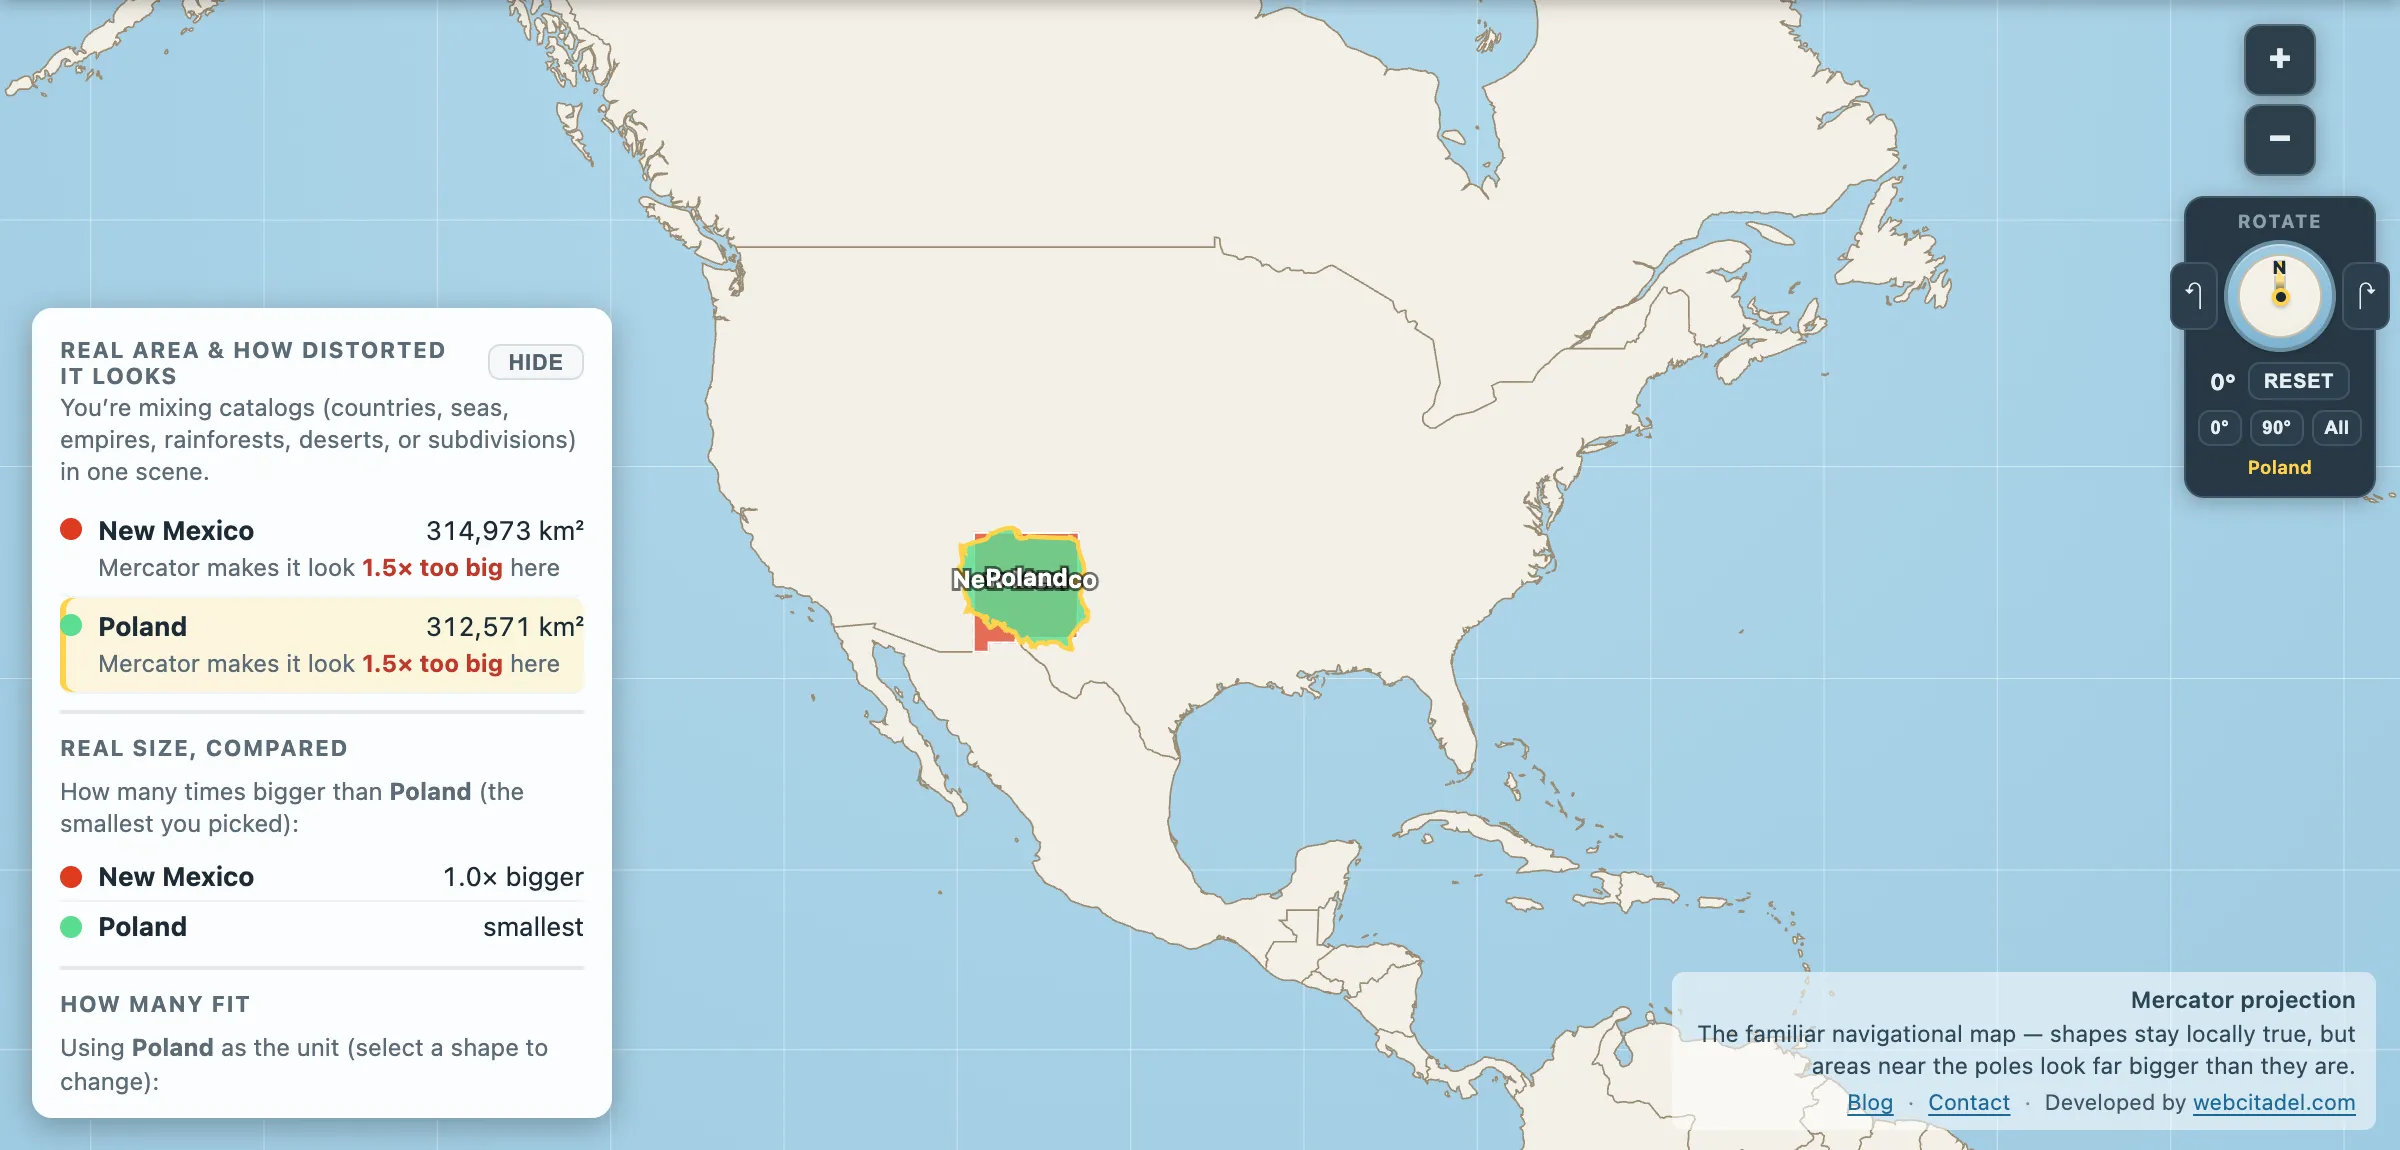
The same shapes on Mercator — the projection almost every map you see uses. Watch what it does to anything far from the equator.
Sources & methodology
- US state areas are computed from the us-atlas 1:10m states dataset; country areas from the world-atlas 1:50m countries dataset — the same data the app draws. Both are geodesic areas on the sphere.
- These are total areas including inland water, computed from polygon geometry, so they differ slightly from official land-area figures. Michigan and Louisiana are the most affected.
- Matches were found by taking each state and selecting the country with the smallest percentage difference; a few countries are the best match for more than one state, and both are listed.